

The whole plant on one screen
A live view of production, energy and downtime for plant directors, production managers and energy managers – instead of manual reporting in Excel.
01
What you get
A site map with production zones and equipment status on one panel
Per-phase electricity metering with energy price tracking on the OKTE and OTE spot markets – input for energy purchasing and ESG reporting including CO₂
Forklift and material-handling tracking – location, operating hours, impacts and battery status
Downtime, cycles and piece counts taken straight from machines and sensors – the basis for OEE
The licence grows with the complexity of the solution, not with the number of sensors or users; when you expand, you pay for hardware and any licence change
02
A look at the system
Screens from the platform demo environment.
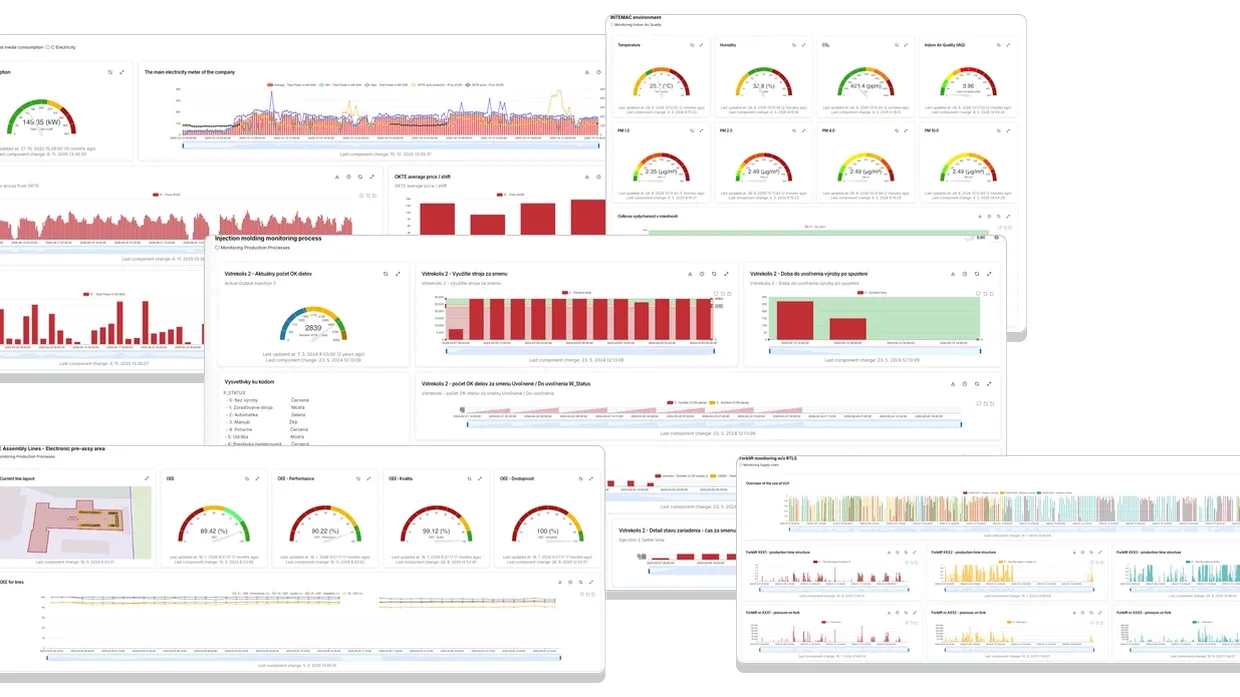
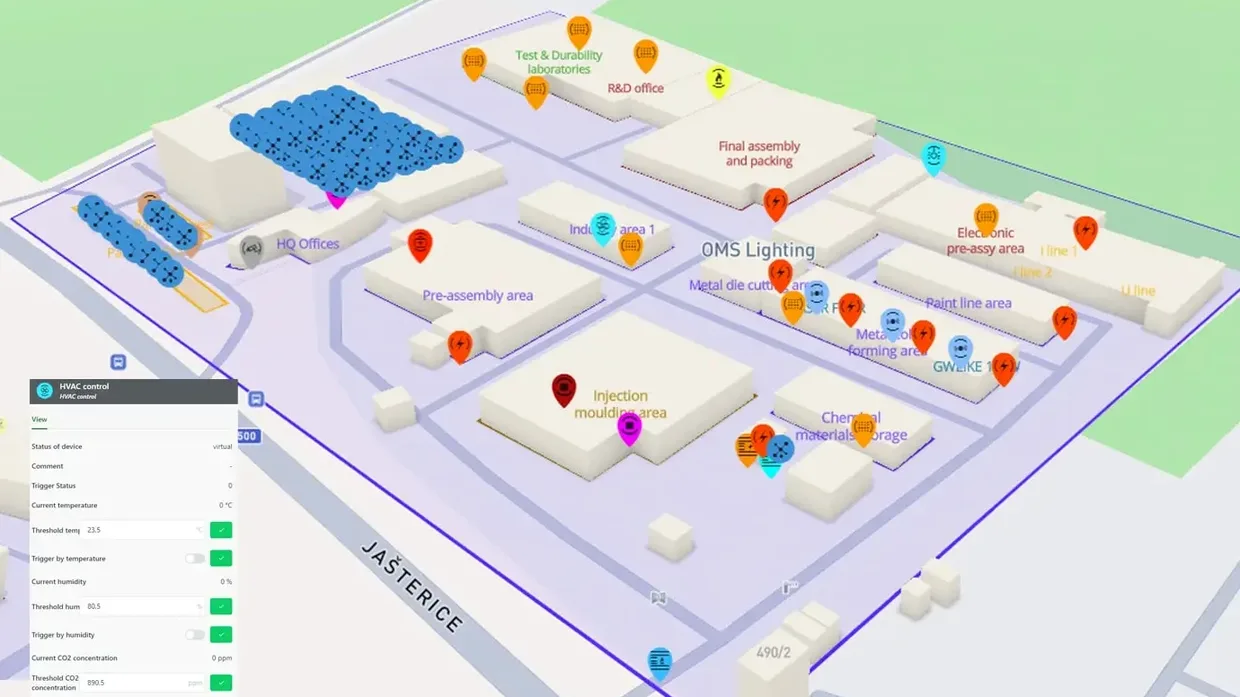
Map data © Mapbox, © OpenStreetMap contributors, © Maxar.
03
Who it is for
- Plant directors
- Production and operations managers
- Energy managers
- Maintenance teams
04
How it works
- We connect the metering, machines and material-handling fleet the plant already runs – we do not replace them
- We bring the data together into a single panel with a site map and equipment status
- Per-phase electricity metering is paired with energy price tracking – input for purchasing and for ESG reporting
- Alarms from the plant are taken over by MaintenanceDesk and turned into maintenance tickets
05
Integrations
- Modbus
- MQTT
- OPC UA
- Siemens S7
Next step
30 + 30 minutes, no obligation: a walkthrough of the system, then we look at what you are dealing with in the live system.
- 00–30 · system walkthrough
- 30–60 · what you are dealing with, in the live system
- no obligation · no slide deck
No slot works for you? Email [email protected].